ATR For Stop Loss (Overlay)This script is an enhancement of ATR Indicator.
It is used to determine the stop loss position by using the ATR indicator, in conjunction with the low of the candle.
Formula = Stop Loss = Lowest(Lowest Length) - (ATR Multiplier * ATR (Smoothing, Length))
However, the user needs to manually identify the swing low for a better stop loss placement.
Parameter Information :
- Length : Period to calculate the average true range.
- Smoothing : The method used for averaging.
- ATR Multiplier : Multiplier factor to determine the Stop Loss from the lowest reference point. (1 ATR Multiplier means the stop loss would be = Low - ATR)
- Lowest Length : A total number of candle to determine the lowest reference point. (1 means only using the latest candle's low as a lowest reference point)
Have fun and good luck!
Tìm kiếm tập lệnh với "stop loss"
Trailing Stop LossTrailing stop loss indicator to determine when to exit a position.
Multiple trailing stop loss calculation techniques are implemented:
ATR: Determines stop loss using a gap from recent highest value, that gap is defined by the ATR value and a multiplier
MA: Just a simple moving average used as a stop-loss
Percentage: Uses a percentage of the price
The script also implements alerting to be notified when the stop loss price is reached.

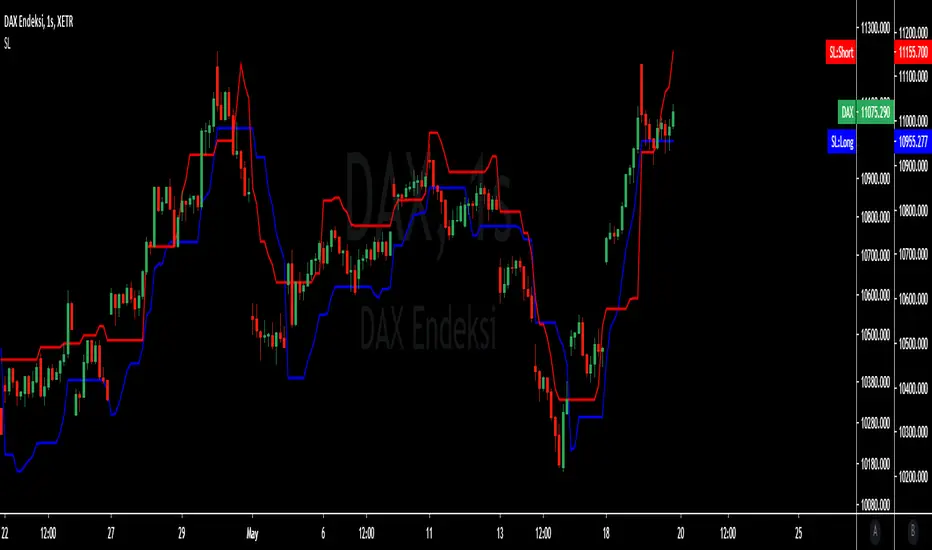
ATR Stop Loss Finder (Strict Breakout Mode)Title: ATR Stop Loss Finder (Strict Breakout Mode)
Description:
Volatility-Based Risk Management: Generates dynamic trailing stop-loss lines for both Long (Lower Line) and Short (Upper Line) positions based on ATR volatility.
Strict Breakout Detection: Features a unique "Strict Breakout" logic that highlights trend acceleration. It visually marks whenever the Long SL breaks a historical high or the Short SL breaks a historical low over a user-defined lookback period (e.g., 50 bars).
Visual Signals: Automatically plots Red Circles for bullish SL breakouts (New Highs) and Blue Circles for bearish SL breakdowns (New Lows), making strong momentum shifts easy to spot.
Real-Time Dashboard: Includes an informative table displaying current ATR and SL price levels for quick reference.

ATR or % Based Trailing Stop for Delta Exchange (trade_crush)This indicator calculates and visually displays a dynamic trailing stop line on the chart based on either the Average True Range (ATR) or a fixed percentage of the current close price. Designed especially for futures or crypto traders using Delta Exchange, it helps determine where to place trailing stop loss orders to manage risk effectively.

RSI-EMA-Crossing with Donchian-Stop-LossThe Donchian RSI Indicator is a visual tool that combines momentum and trend analysis to identify high-quality long opportunities based on RSI crossovers, price action, and Donchian channel dynamics.
How It Works
Momentum Signal: A bullish RSI crossover is detected when the RSI crosses above its moving average.
Trend Filter: A signal is only valid if the crossover occurs while the price is above its moving average – filtering out entries against the prevailing trend.
Signal Candle: The high of the crossover candle is stored.
Entry Trigger: A valid signal occurs when a later candle closes above that signal high.
Stop-Loss (Visual Only)
The lower band of the Donchian Channel acts as a visual reference for a dynamic stop-loss level.
Features
Customizable RSI, Donchian Channel, and moving average lengths
Selectable MA types: SMA, EMA, WMA, VWMA, HMA
Signal candle highlighted (yellow background)
Entry points labeled on the chart
Price MA and Donchian Channel plotted
Trend filter improves signal quality by confirming upward bias
Use Case
Designed for swing and position traders
Optimized for use on daily or 4H charts

Smart Breakout with ATR Stop-LossThe Smart Breakout indicator combines a classic 20-day Donchian channel breakout with a tight trailing stop, drawing green lines and “ENTRY” labels at the bar after a valid breakout, and red lines and “EXIT” label at the bar after a stop-loss breach.
By default it uses the chart’s timeframe to compute ATR and stops, but you can flip on Daily lock to freeze both ATR and price reads at the daily resolution—so your stops stay the same whether you view at 1s, 15 m, 4h or lower frequency bars.
Key features:
20-day Donchian breakout: entry when price closes above the highest high of the previous 20 bars
2 × ATR(14) trailing stop: initialized at entry and raised only when the new (close – 2 × ATR) exceeds the prior stop
Daily lock option: Ensures all ATR and close values are calculated on the daily timeframe, keeping stop levels consistent across resolutions

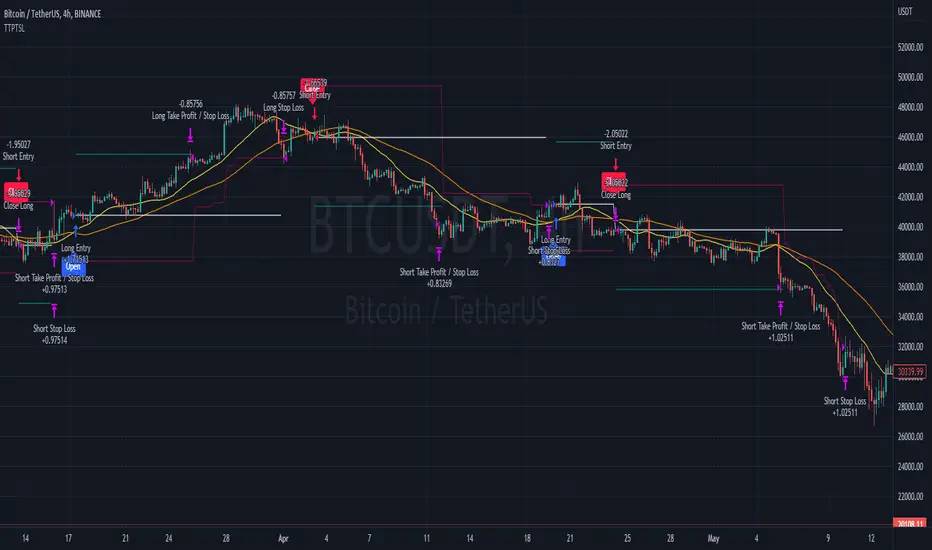
TRP Stop-Loss and Position SizingScript is based on TRP to see both Long Stop Loss and Short Stop Loss, You can Also adjust the position size based on your capital and percentage risk.

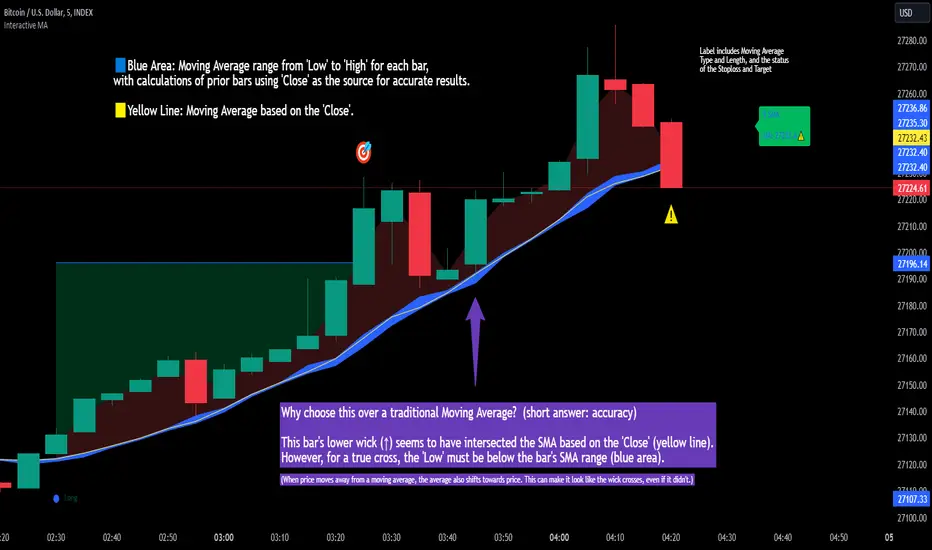
Interactive MA Stop Loss [TANHEF]This indicator is "Interactive." Once added to the chart, you need to click the start point for the moving average stoploss. Dragging it afterward will modify its position.
Why choose this indicator over a traditional Moving Average?
To accurately determine that a wick has crossed a moving average, you must examine the moving average's range on that bar (blue area on this indicator) and ensure the wick fully traverses this area.
When the price moves away from a moving average, the average also shifts towards the price. This can make it look like the wick crossed the average, even if it didn't.
How is the moving average area calculated?
For each bar, the moving average calculation is standard, but when the current bar is involved, its high or low is used instead of the close. For precise results, simply setting the source in a typical moving average calculation to 'Low' or 'High' is not sufficient in calculating the moving average area on a current bar.
Moving Average Options:
Simple Moving Average
Exponential Moving Average
Relative Moving Average
Weighted Moving Average
Indicator Explanation
After adding indicator to chart, you must click on a location to begin an entry.
The moving average type can be set and length modified to adjust the stoploss. An optional profit target may be added.
A symbol is display when the stoploss and profit target are hit. If a position is create that is not valid, "Overlapping MA and Bar" is displayed.
Alerts
'Check' alerts to use within indicator settings (stop hit and/or profit target hit).
Select 'Create Alert'
Set the condition to 'Interactive MA''
Select create.
Alert messages can have additional details using these words in between two Curly (Brace) Brackets:
{{stop}} = MA stop-loss (price)
{{upper}} = Upper MA band (price)
{{lower}} = Lower MA band (price)
{{band}} = Lower or Upper stoploss (word)
{{type}} = Long or Short stop-loss (word)
{{stopdistance}} = Stoploss Distance (%)
{{targetdistance}} = Target Distance (%)
{{starttime}} = Start time of stoploss (day:hour:minute)
{{maLength}} = MA Length (input)
{{maType}} = MA Type (input)
{{target}} = Price target (price)
{{trigger}} = Wick or Close Trigger input (input)
{{ticker}} = Ticker of chart (word)
{{exchange}} = Exchange of chart (word)
{{description}} = Description of ticker (words)
{{close}} = Bar close (price)
{{open}} = Bar open (price)
{{high}} = Bar high (price)
{{low}} = Bar low (price)
{{hl2}} = Bar HL2 (price)
{{volume}} = Bar volume (value)
{{time}} = Current time (day:hour:minute)
{{interval}} = Chart timeframe
{{newline}} = New line for text
I will add further moving averages types in the future. If you suggestions post them below.
Manual Stop Loss / Risk Management PanelHere is a panel where you enter the desired stop-loss price, the amount you would like to risk and it spits out what you should trade to only lose that amount if the stop-loss is hit.

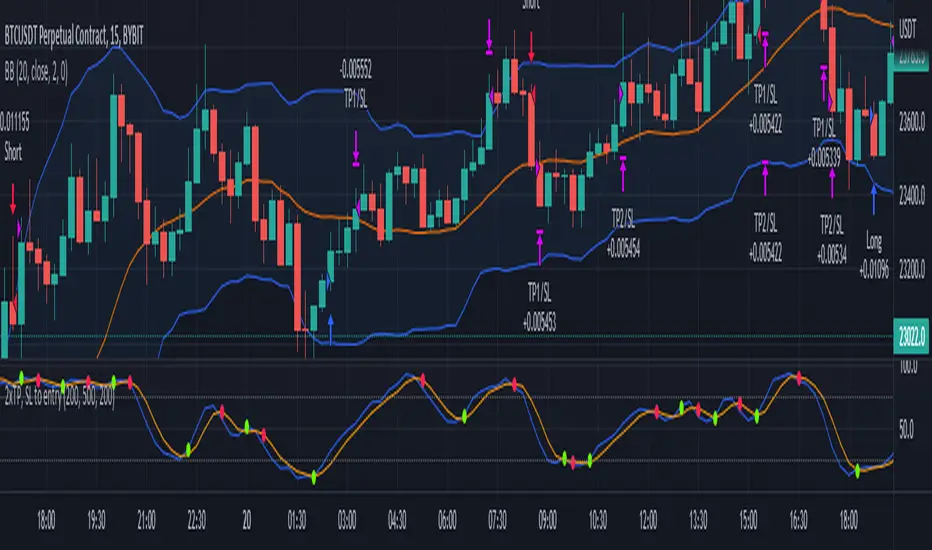
2x take profit, move stop loss to entryTwo take profit targets moving stop loss to entry after first take profit hit
This strategy shows a method to achieve the following trade management:
1) Open a position with two take profit targets
2) When first take profit is hit, move the stop loss to entry price
3) Position is closed when either second take profit is hit or position is stopped out at entry
Trading Conditions
The trading conditions used in this script are for illustrative purposes only and are not meant to be profitable.
Bollinger Bands
Used to show areas where price is moving outside of the normal range
Stochastic
Used to show overbought and oversold conditions.
Green dots are plotted when the K line crosses over its SMA. Red dots are plotted when the K line crosses under its SMA.
The option to use overbought/oversold thresholds is again illustrative.
Buy Monday, Exit Tuesday with Stop Loss and Take ProfitStrategy to go long at end of Monday before market closes and exit before Tuesday close, or at stop loss or take profit percentages
This runs strategy on entering by weekday name and also by session time.
Implemented are also Take Profit and Stop Loss to exit position using custom inputs.
Added stoploss and take profit plot lines

Trailing Stop LossThis script demonstrate how to make a Training Stop Loss to "ride the wave". In comparison to classic Stop Loss this strategy follows the price upwards (for long positions) and when price drops by a fixed percentage then you exit your position.

CRYPTO 3EMA Strategy with Take Profit & Stop Loss based on ATRSimple 3 EMA Strategy with plotted Take Profit and Stop Loss
Entry condition:
- Middle EMA cross above the Slow EMA
- Set take profit and stop loss exit conditions based on ATR Indicator
Exit condition:
- Fast EMA cross below the Middle EMA

Trailing Take Profit Trailing Stop LossThis script demonstrated a dual trailing take profit and stop loss strategy. Where you take 50% (configurable) of the profit when a price level is reached and then you get the rest when a trailing stop loss is hit.
ATR ChannelsATR Channels help you to identify where to place your stop-loss or trailing stop-loss based on price volatility, according to the Average True Range (ATR).

MavilimW and Stop Loss IndicatorMavlimW and Stop Loss Indicator scripts which have prepared by kivancfr3762, are merged .
kivancfr3762 hocanın önemli çalışmaları, mavilimW ve Stop Loss Indicator betiklerinin birleştirilmiş halidir.

Dual MA Crossover with Profit Targets + Stop-LossChatGPT script and is a dual moving average crossover script with profit targets and stop loss

SMA150 Stop Loss AlertSMA150 indicator that alerts you when stock falls under 150 with additional of -2% (for avoiding early stop-loss)

AI - Williams Alligator Strategy (ATR Stop-Loss) AlertsAI - Williams Alligator Strategy (ATR Stop-Loss) with Alerts

ATR stop lossPlots the stop loss level based on average true range (ATR) and a multiplier of choice (1 to 2.5, default is 1.5), subtracted from closing price.
Additions in this version:
You can now show percentage labels to help evaluate the level of risk.
The color of the plotted line and the text labels can be picked by the user.

Mastering ATR for Smart Stop Loss and Take Profit PlacementUsing the ATR indicator to set Stop Loss and Take Profit levels provides a dynamic and flexible way to manage risk based on the volatility of the market. This method ensures that your SL and TP are always in tune with current market conditions, preventing unnecessary stop-outs while maximizing the potential for profit. The table in the script makes it easy to view your calculated levels directly on the chart, improving your trading efficiency.
If you're looking for a more automated way to manage your trades, integrating ATR-based SL and TP can be a powerful tool in your strategy.
Happy Trading!

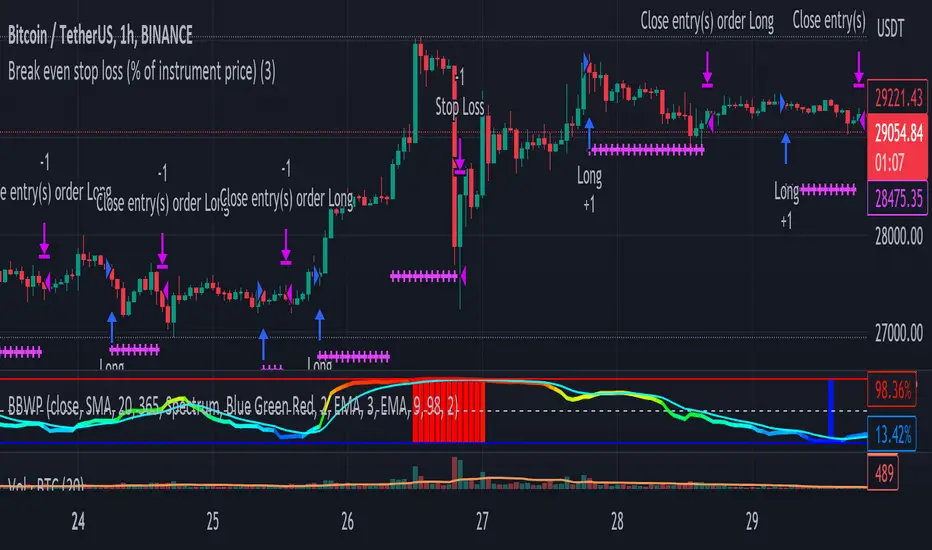
Break even stop loss (% of instrument price)Simply proof of concept to place a stop loss a percentage below entry price and move it to break even if the price moves the same percentage above the entre price.